Crypto market
analytics platform
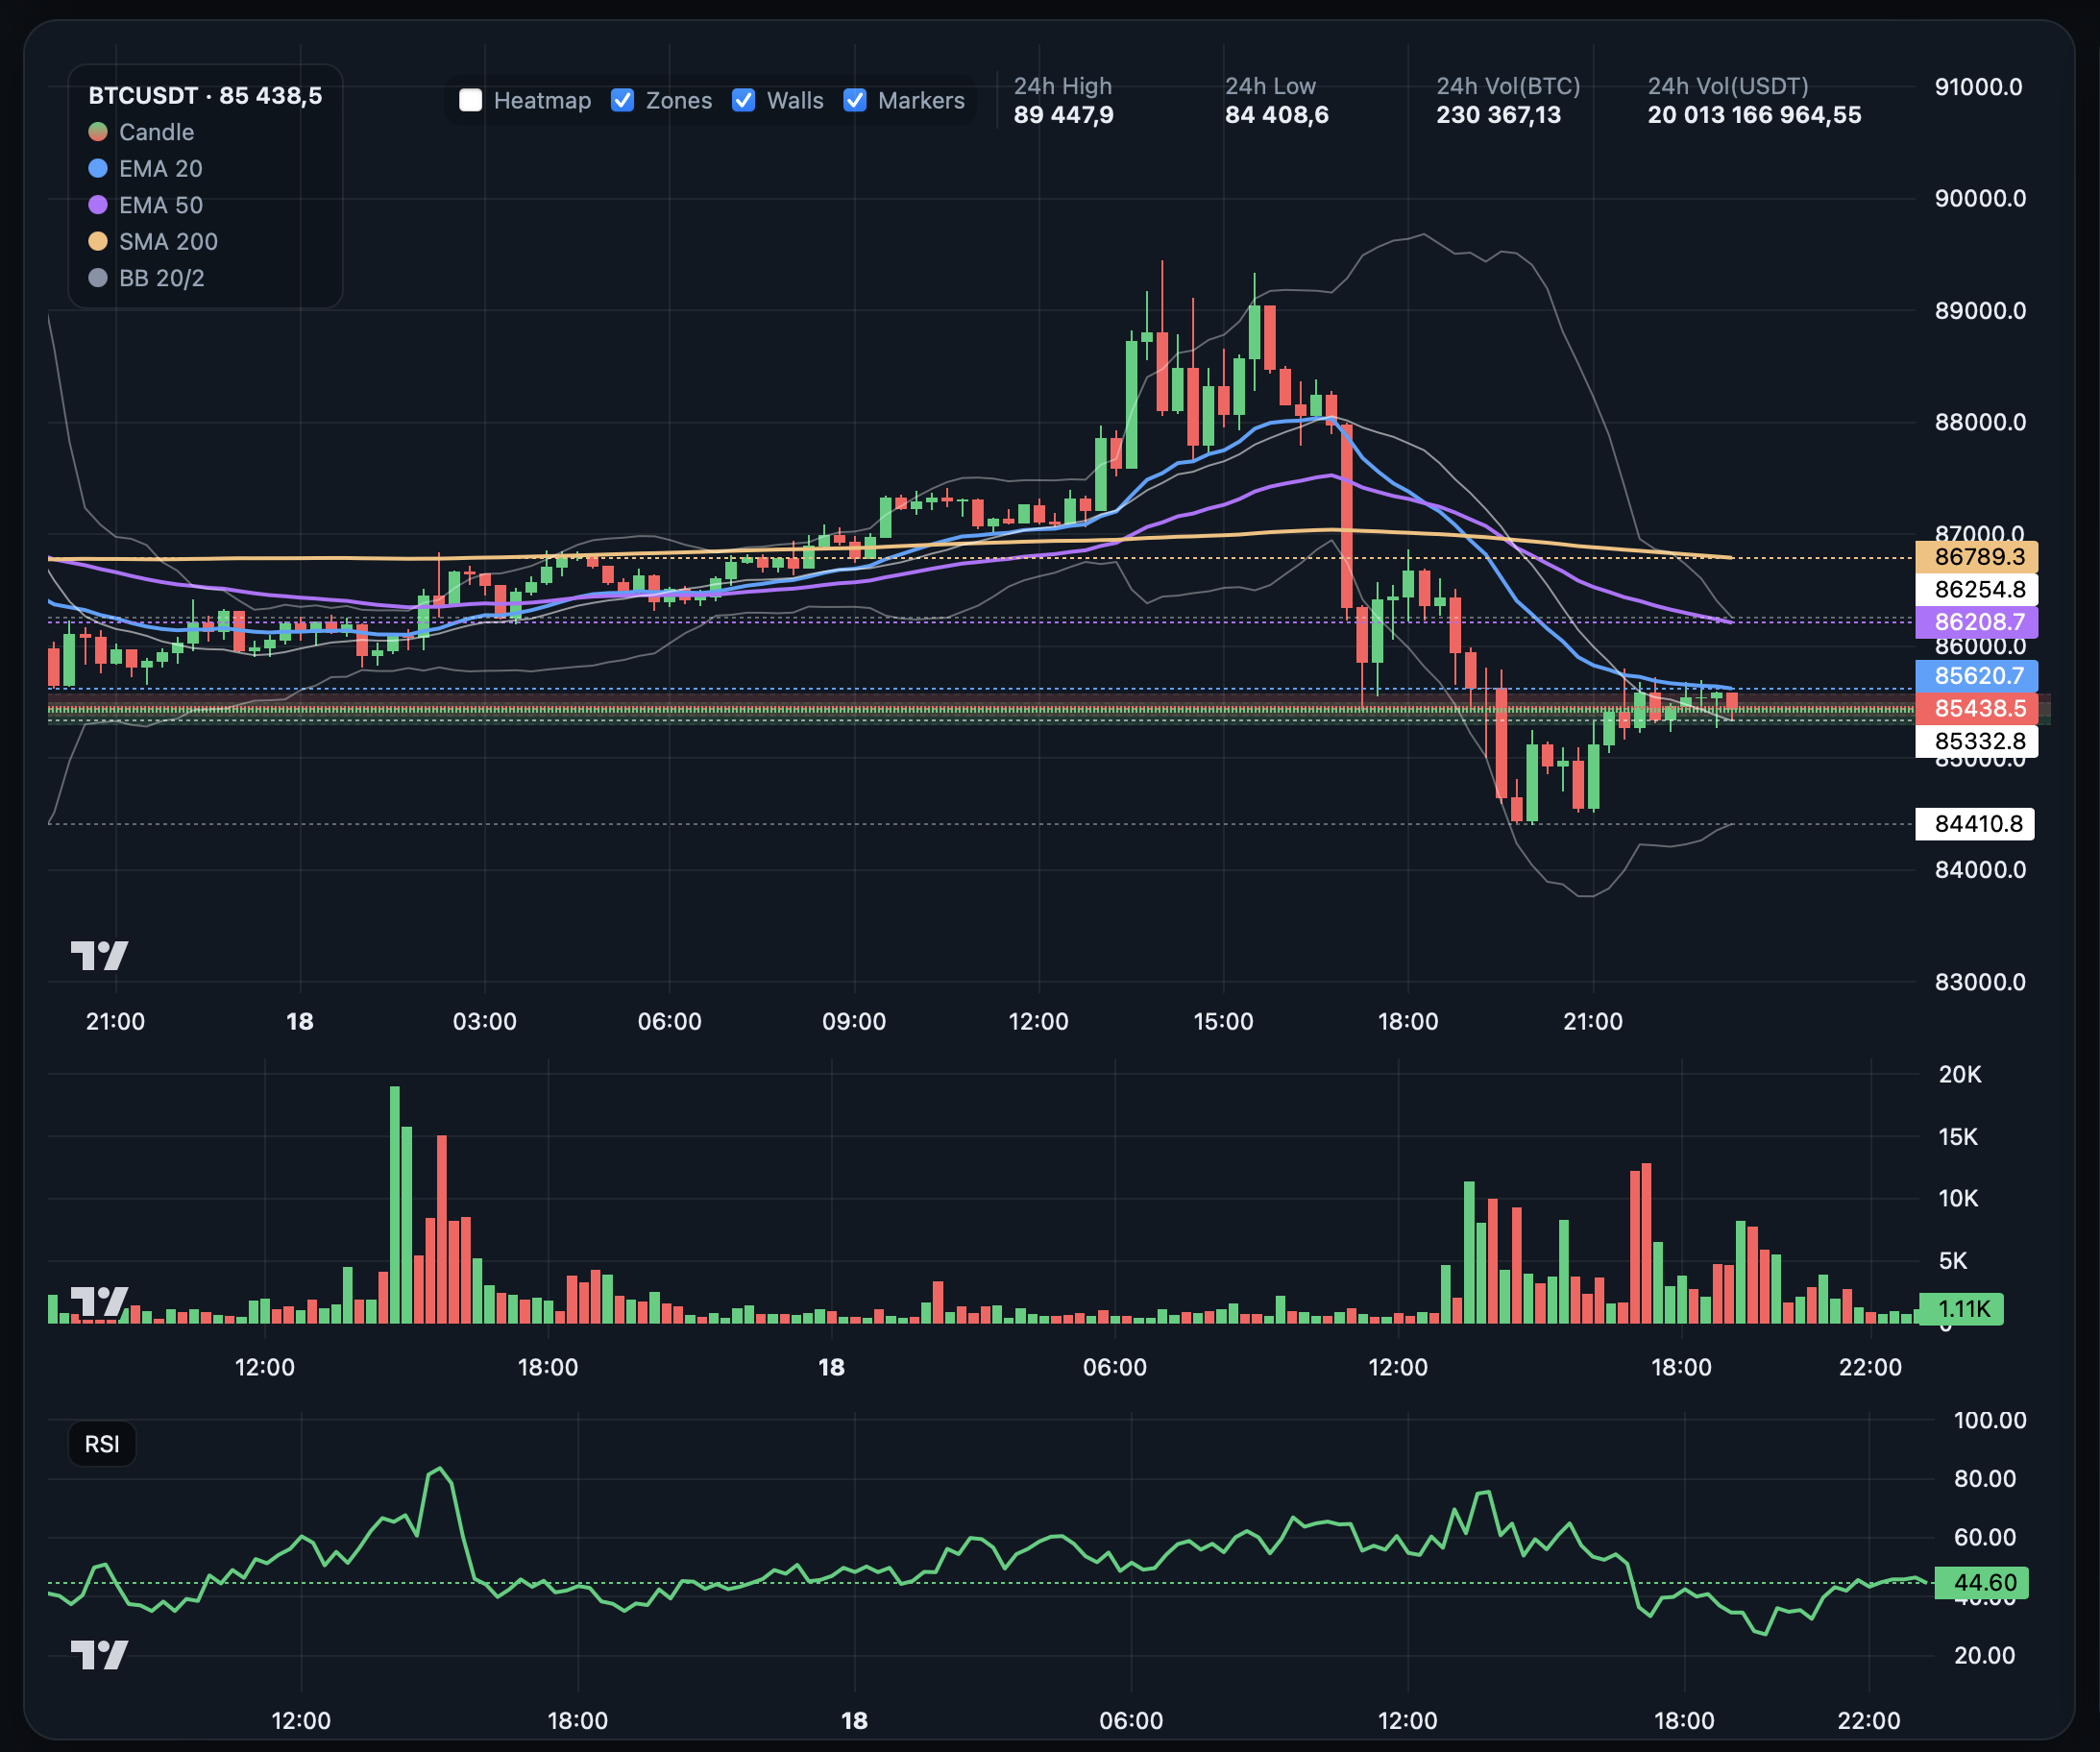
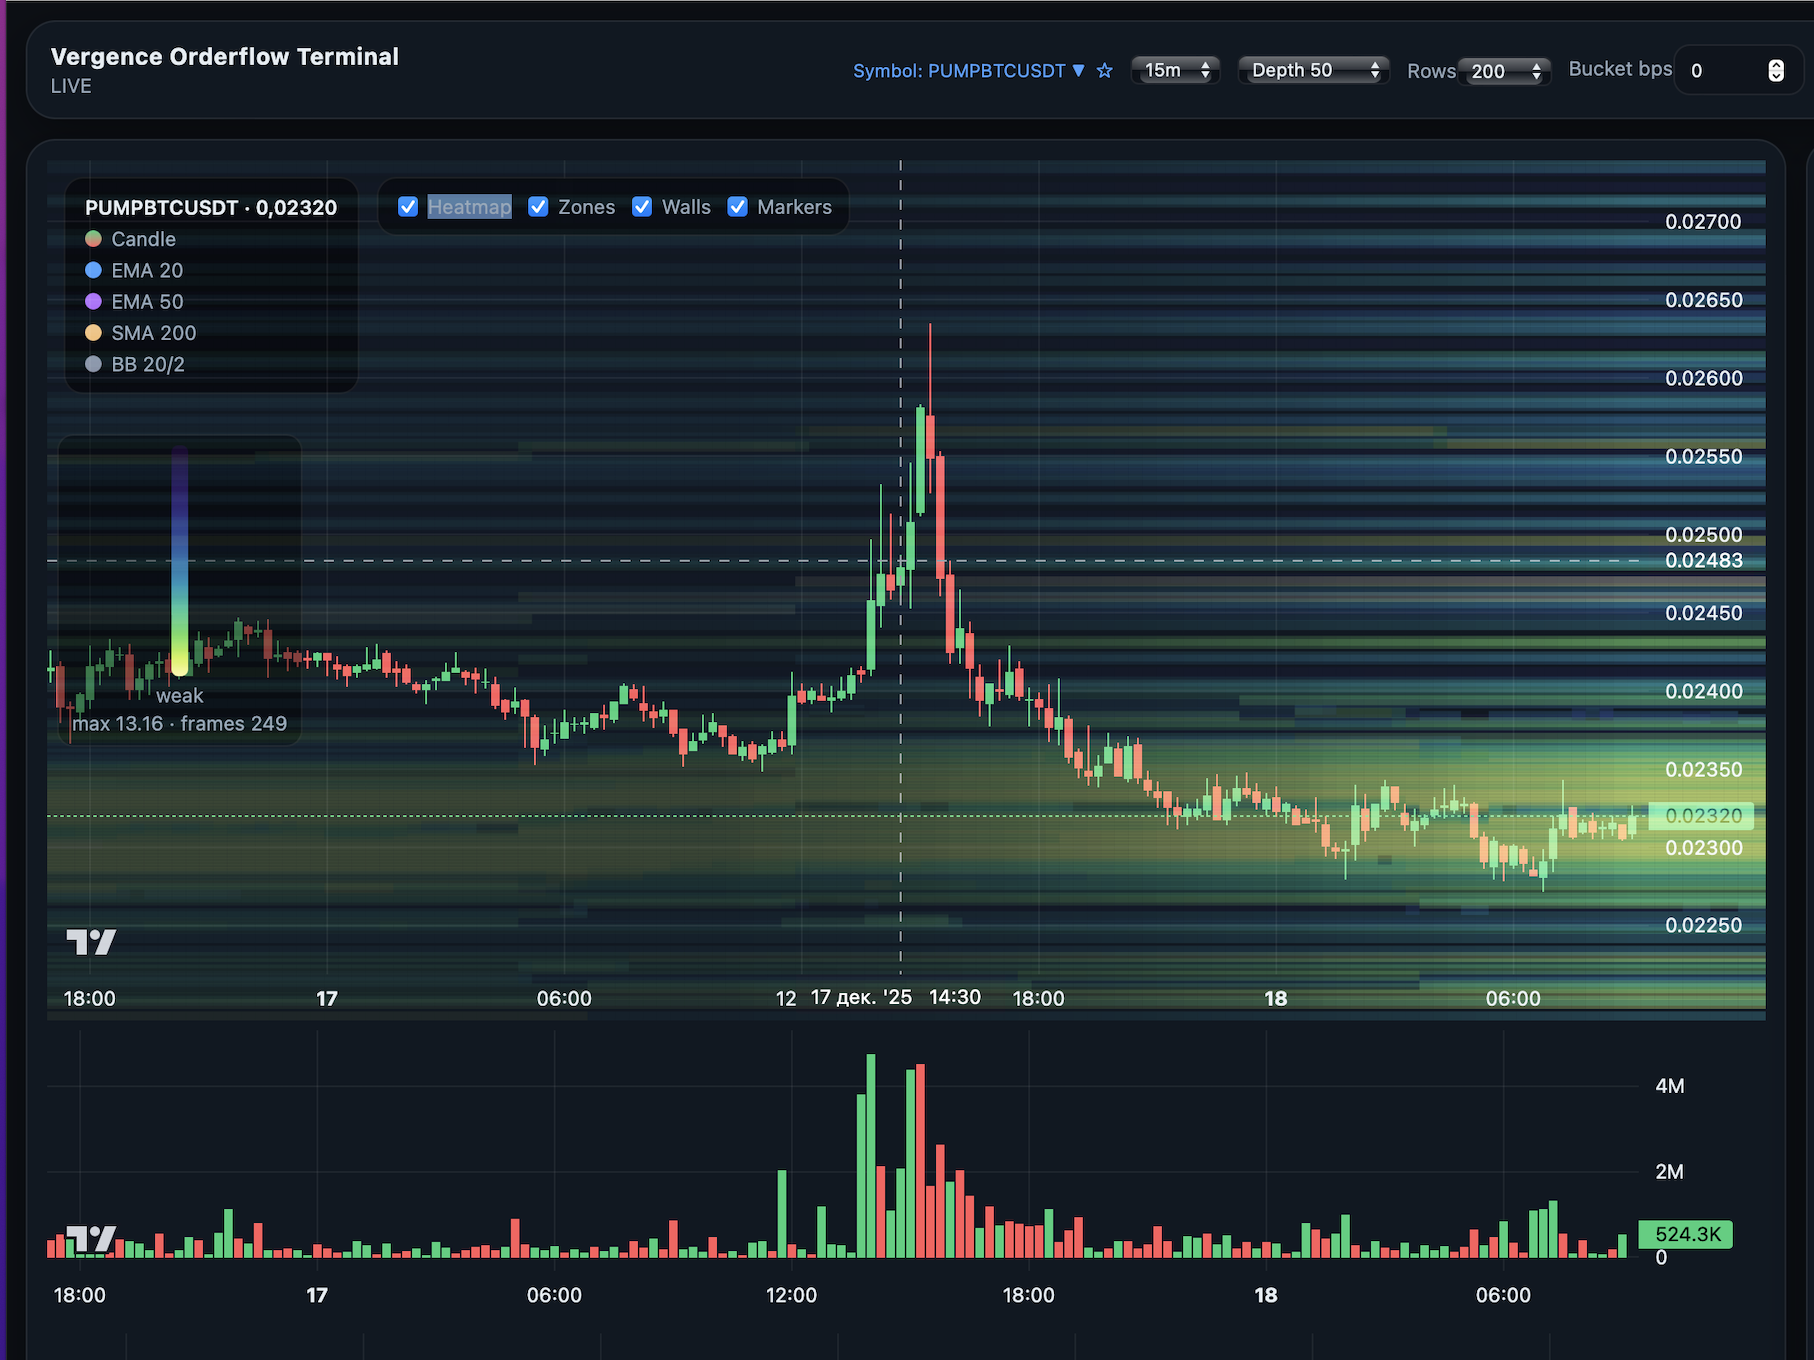
Analyze liquidity, order flow, cluster volume, and market structure in one professional workspace. Built for monitoring, research, and fast market context.
Monitor price and market microstructure together: liquidity, zones, flow shifts, and market events in one interface.
Sync instruments, intervals and zones across panels.
Find markets and presets in one click.
Compare instruments and find divergences.
From seconds to higher timeframes — for research and monitoring.
Shows volume distribution by price level for every candle in the selected range — useful for analyzing aggression and validating key liquidity context.
Track dozens of instruments and scenarios in one list. Alerts are tied to your monitoring rules: zones, delta shifts, sweeps, wall changes, reclaims, and more.
View detailsStudy repeating cycles and seasonality. Compare years to build stronger market context.
Open seasonalityOverlay metrics and compare instruments. Build additional analytical layers on top of price behavior.
Compare metricsShort answers about platform capabilities, data, and research workflows.
Vergence is a crypto market analytics platform for monitoring liquidity, order flow, cluster volume, and market structure in one workspace.
You can analyze liquidity maps, order flow dynamics, cluster volume distribution, market structure changes, and event-driven market behavior.
Klines, order book (snapshot + deltas), trades, mark/index/funding/OI, and symbol metadata (tickSize/precision) for exact price steps.
Vergence combines price with liquidity and flow context, so you can evaluate market behavior instead of viewing candles in isolation.
A time-by-price liquidity map that helps identify defended levels, reaction areas, and absorption behavior.
Cluster volume shows how traded volume is distributed by price level inside each candle to reveal active and passive participation.
Zones and walls are liquidity structure elements that help contextualize where market reactions or absorption are more likely.
Markers are visual annotations that highlight key events and market states directly on the chart for faster interpretation.
Yes. You can configure alerts for liquidity events, flow changes, volume behavior, and custom monitoring conditions.
Yes. You can configure multi-panel layouts, switch instruments and intervals quickly, and build custom research workflows.
No. Vergence is not an exchange, broker, or custody provider. It is a market analytics and research platform.
No. All analytics, visualizations, and alerts are provided for informational and market research purposes only.